Last modified: 13 March 2025
Application throughput
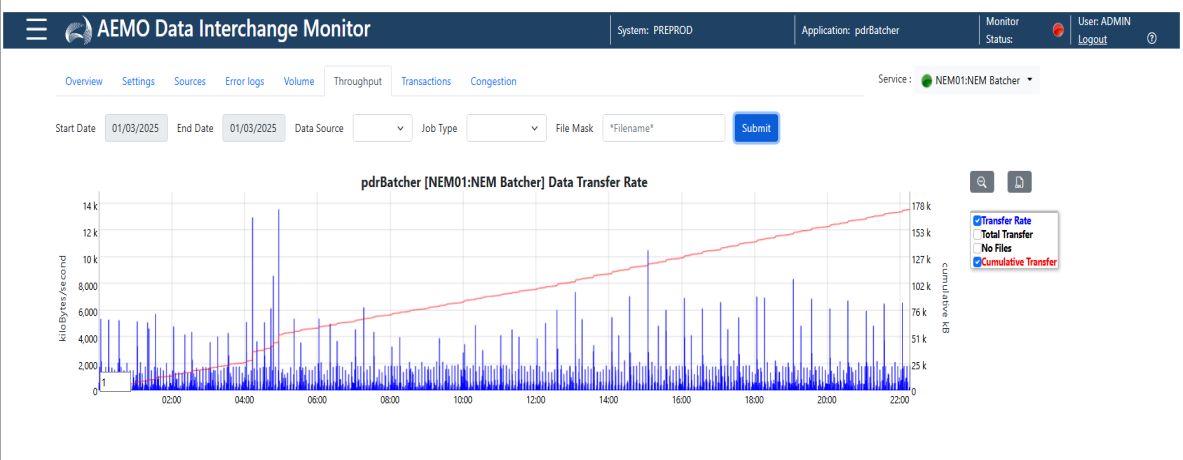
The application Throughput tab displays the data transfer rate of the application.
This interface is read only and shows a summary of rate of data transfer within the specified report parameter critieria.
- Login to pdrMonitor, click a system name, click pdrBatcher or pdrLoader and then click Throughput.
- Select the Service you want to view.
- Click the Start and End Dates, select from the date picker and then click Submit.
Optionally, you can further filter using the Data Source , Job Type and File Mask select boxes
- If you have multiple application instance, you can view each using the Select Service drop-down.
Selecting All Services in the service selector provides an aggregate view across all application instances in the system.