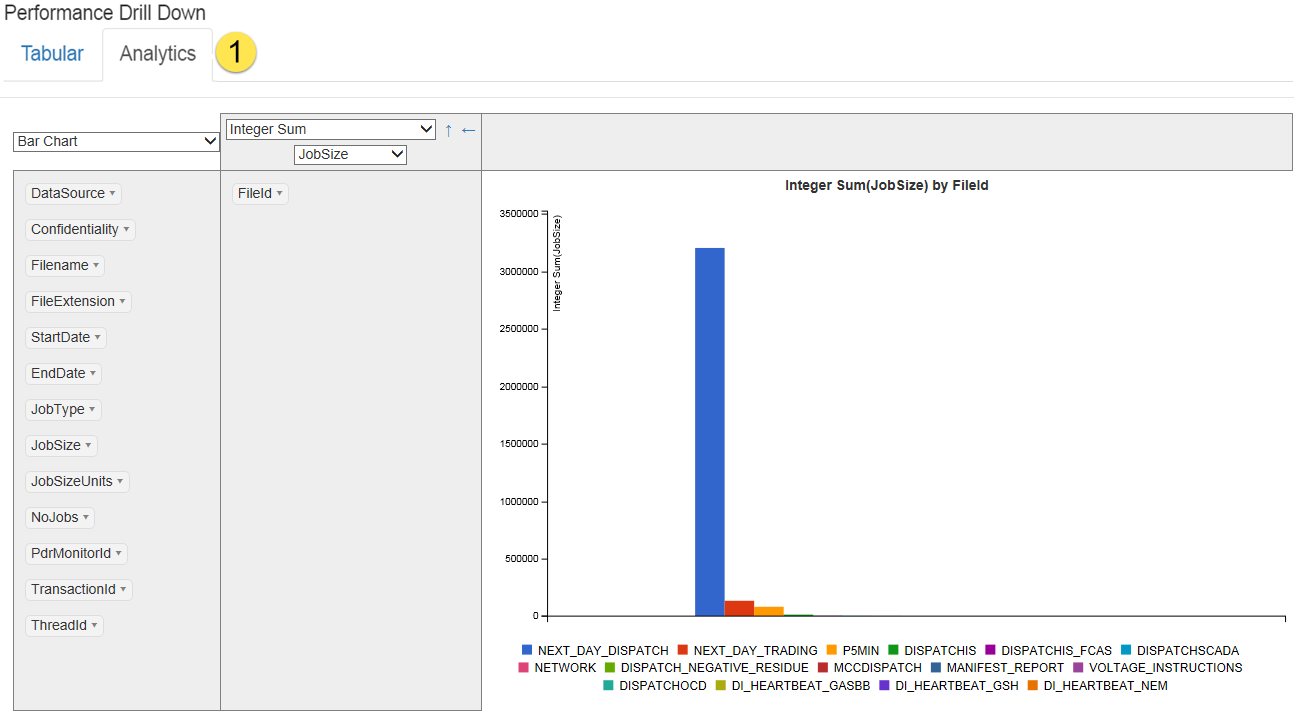
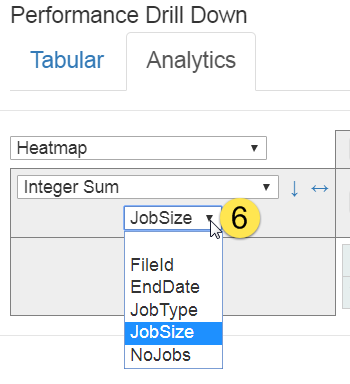
Performance analytics
The Analytics tab displays a pivot chart representation of the individual jobs comprising the performance summary.
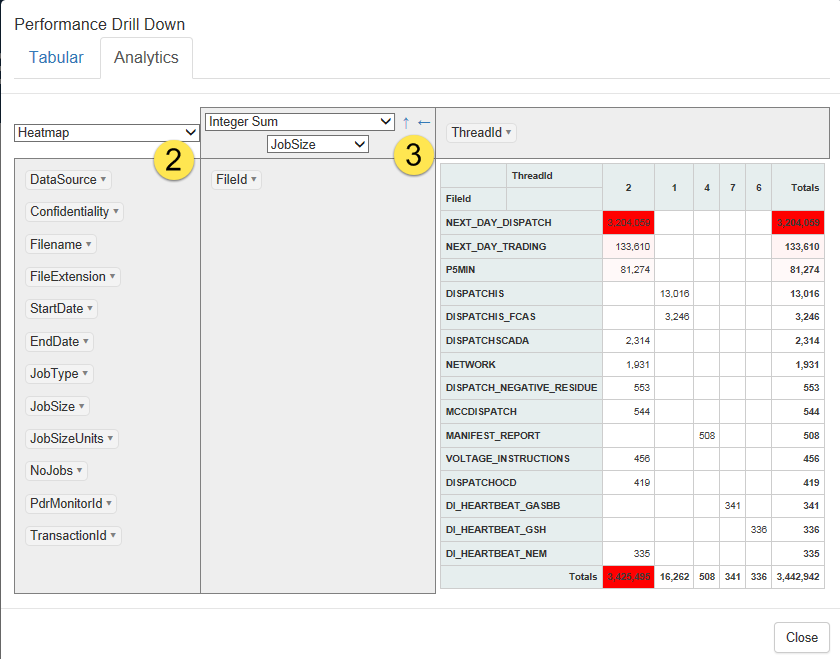
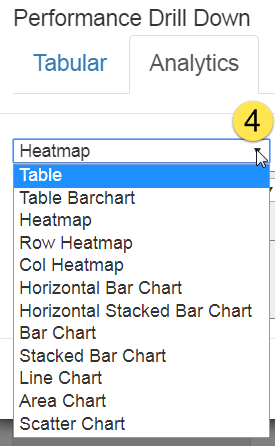
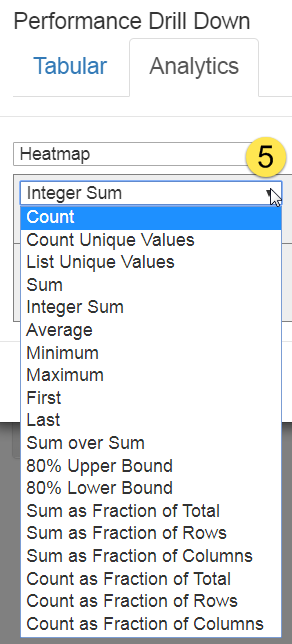
You can manipulate the reporting component to segment the data in various ways, providing insight into the overall activity of the system.
For example, you can: